Part 7: The Alignment Survived. The Lost Civilization Didn't

Part 7 of an ongoing investigation. Part 1 | Part 2 | Part 3 | Part 4 | Part 5 | Part 6.
Paper 1 and Paper 2 on Zenodo (1) // Zenodo (2)
Code on GitHub. Globe at thegreatcircle.earth.
Over six parts, we’ve established what the Great Circle alignment is and what it isn’t.
It is: a statistically real pattern, replicated on eight databases, showing monument-specific clustering (5× expected) that settlements don’t share, concentrated at the Memphis necropolis during 2750–2250 BCE, at the perpendicular crossing of the circle and an ancient Nile channel, producing the strongest monument-settlement divergence of any tested great circle through major archaeological sites.
It isn’t: a corridor of habitation within the Fertile Crescent. A trade route. A geological feature. An astronomical alignment. A geophysical anomaly. A preservation artifact. A pre-Younger Dryas civilization footprint. A precessional longitude grid. A Younger Dryas catastrophe signature. Or — despite initial null results — exclusively an Old World phenomenon. With consistent classification, the divergence replicates in the New World too.
This is the part where we talk about what we don’t know.
The geometric question
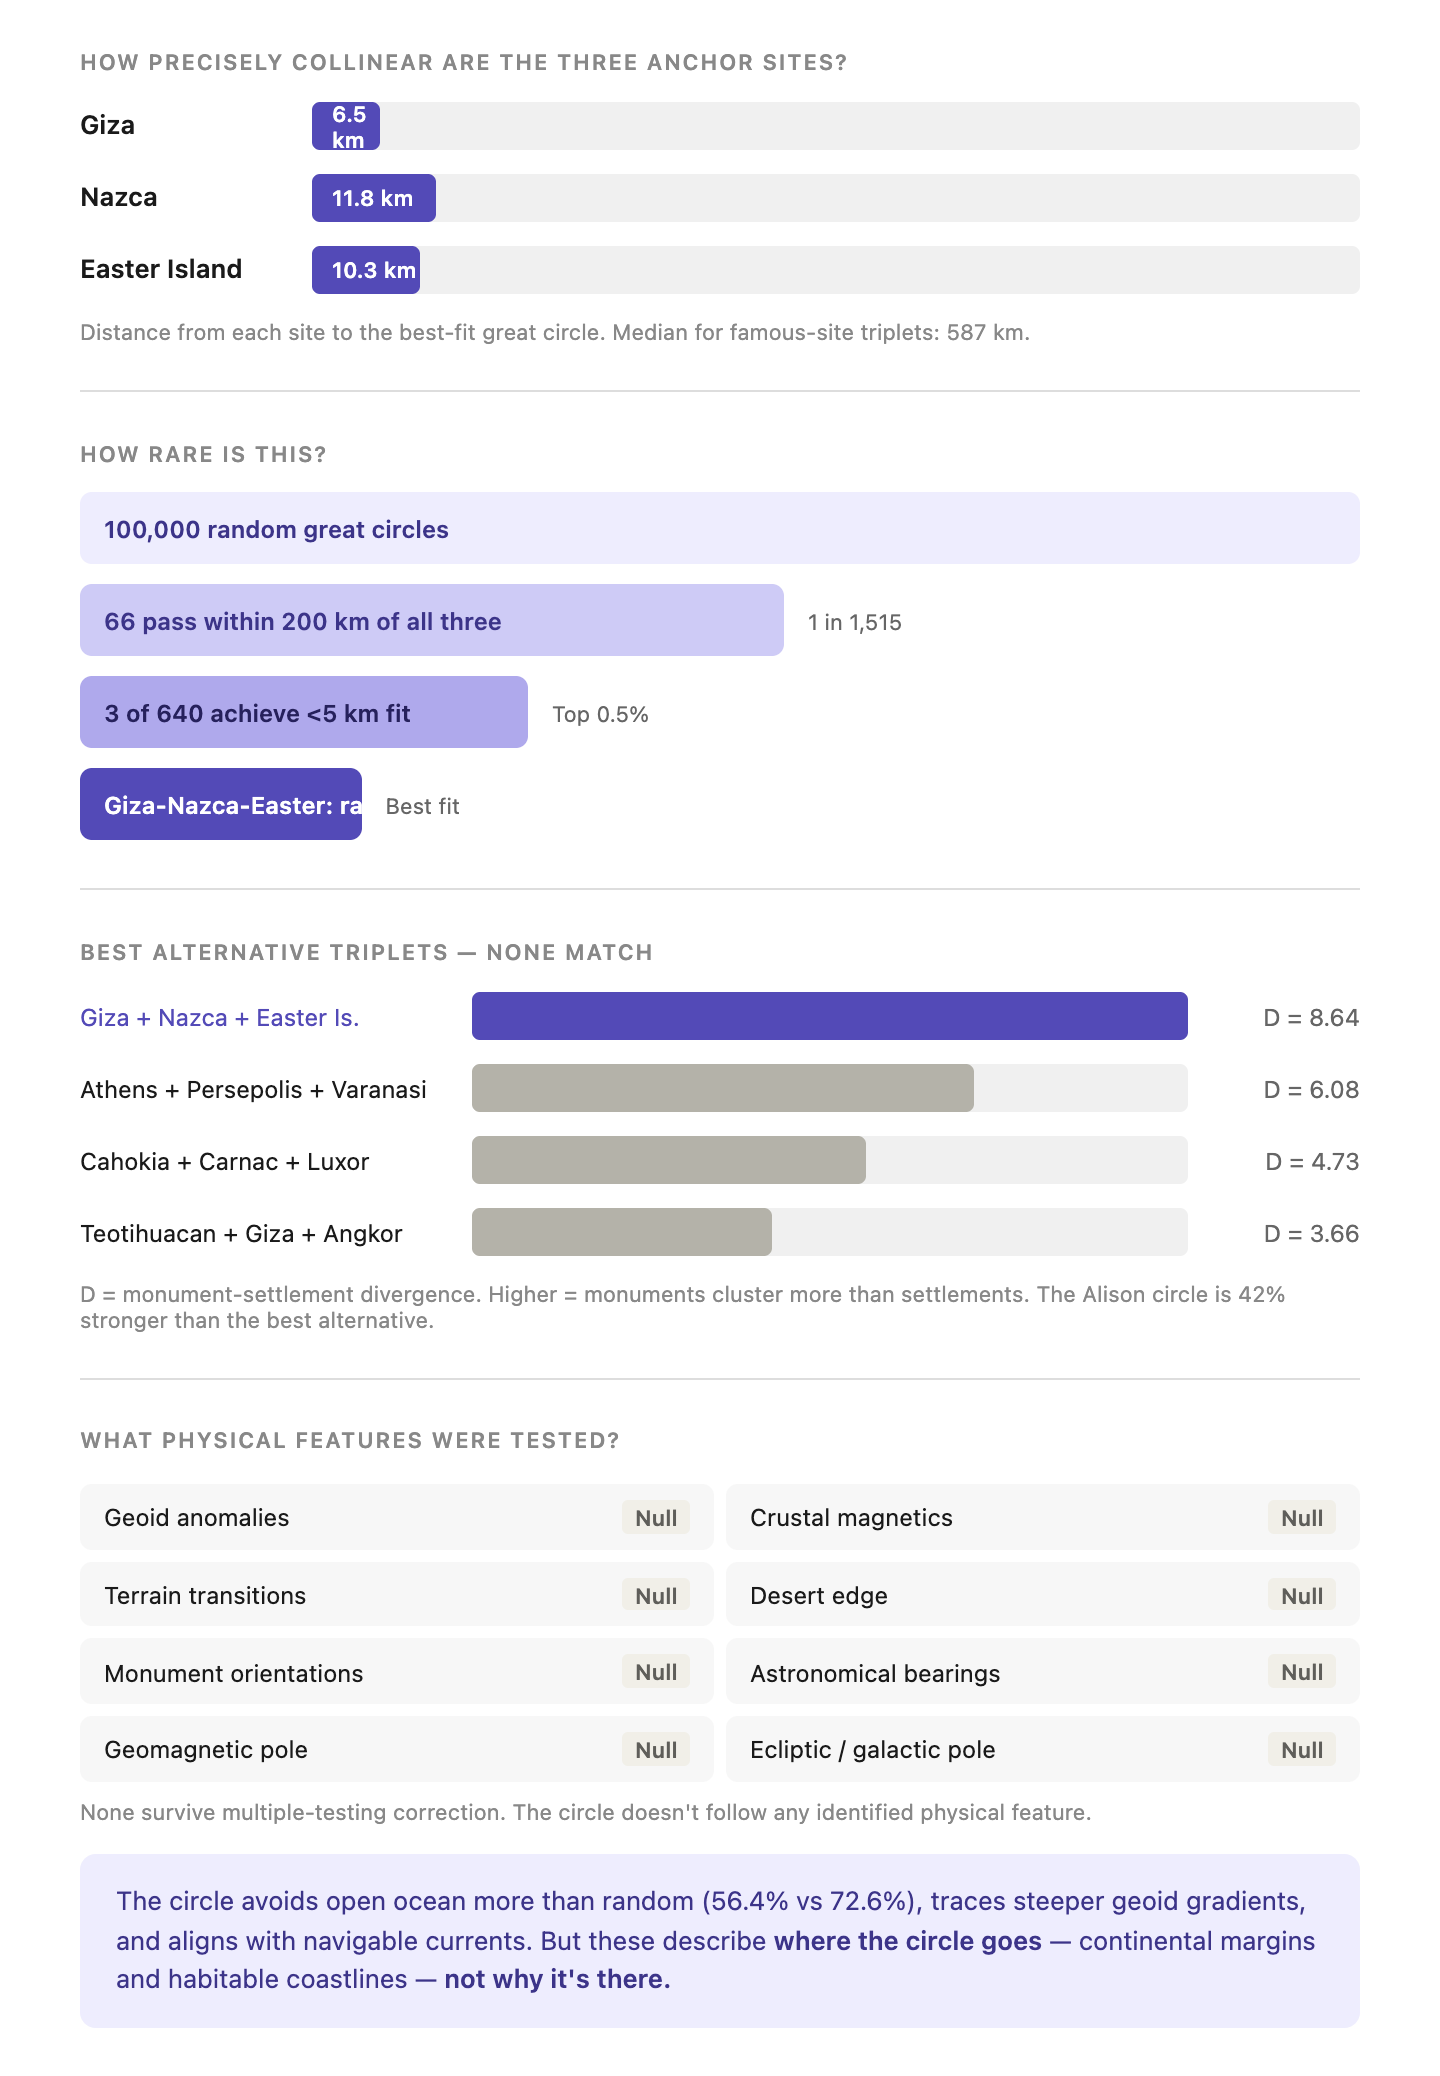
Giza, Nazca, and Easter Island are more precisely collinear than almost any other combination of famous archaeological sites we tested. The circle passes within 6.5 km of all three. Most triplets of famous sites can’t be fit below 100 km.
Only 66 out of 100,000 random great circles pass within 200 km of all three. That’s 1 in 1,515. The collinearity is real and rare — but three points on a sphere always define a great circle, so the existence of a circle through them is guaranteed. The question isn’t whether a circle connects them. It’s whether the PROPERTIES of that circle are unusual.
They are. The monument-settlement divergence (D = 8.64) is 42% stronger than the best alternative triplet we tested. Eight combinations of famous sites — including Athens+Persepolis+Varanasi, a circle through the densest monument zone on Earth — all fall short. The Alison circle produces the strongest monument-settlement divergence of any tested great circle through major archaeological sites, with geometric fit an order of magnitude tighter than most alternatives.
Why? We tested everything we could think of.
The circle doesn’t follow any identified feature. We tested geoid anomalies, crustal magnetic signatures, topographic consistency, ocean current alignment, the Nile desert edge, monument orientations, astronomical bearings, the geomagnetic pole at 2500 BCE, the ecliptic pole, and the galactic pole. Nothing survives multiple-testing correction.
The Memphis coincidence
Here’s the most specific version of the puzzle.
The Memphis necropolis — Giza, Saqqara, Abusir, Abu Rawash, Dahshur — is the densest concentration of monumental construction in the ancient world. 38 pyramids and associated structures built during 2750–2250 BCE.

It sits within 10 km of a great circle that also passes through the Nazca plateau and Easter Island, at the perpendicular crossing point of the circle and the Ahramat Branch of the ancient Nile. The circle cuts across the river at roughly 107°. The pyramid cluster straddles the intersection.
This isn’t a corridor. It’s a crossing point. The densest monuments are at the exact spot where the circle intersects the ancient waterway that connected them.
Is that a coincidence? We genuinely don’t know. The Ahramat Branch runs north-south. The circle runs east-west. They meet near Abu Sir. The pyramids cluster around the meeting point. Nobody planned this — the circle was proposed in 2001, the Ahramat Branch was discovered in 2024. Both were identified independently for completely different reasons. And they intersect at the pyramids.
The one confirmed geographic mechanism: the Great Circle crosses the Nile at 29.91°N, within 1 km of the valley’s minimum width (10.6 km at 29.90°N). Memphis was founded 6 km south of this geomorphological chokepoint.
The perpendicular problem
The circle doesn’t follow things. It cuts across them.
It crosses the Nile at 69°. The Levantine coast at 66°. The Zagros at 36–42°. The Indus Valley at 81°. The Peruvian coast at 86°. The Mid-Atlantic Ridge at 62°. Mean intersection angle: 68°.
The natural axis of early Neolithic settlement in the Fertile Crescent runs NNE-SSW (bearing ~14°, bootstrap 95% CI: 8.6°–22.1°). The circle runs east-west (bearing ~88°) through the same region. They’re nearly perpendicular — 74° apart.
And yet the circle still captures more early Holocene activity than 99% of random circles on a global database. It cuts across the grain of every continental feature it encounters and still threads through significant regions on every continent it touches.
But there’s an important caveat we reported in Part 5: when we tested this using a regional database restricted to the Near East (NERD, 11,072 radiocarbon dates), the enrichment dropped to 1.10× — indistinguishable from the regional baseline. The 4–6× enrichment we see on the global p3k14c database reflects the circle’s passage through the Fertile Crescent relative to the rest of the world, not a specific corridor within the Fertile Crescent itself. Among 9 random circles that also pass through the Fertile Crescent, the Alison circle ranked 2nd (Z = 0.89).
Why does a perpendicular cut through the world’s archaeological zones produce a stronger global signal than a parallel one? Because the circle doesn’t follow one region — it connects several. Its advantage is multi-regional geometry, not corridor-like habitation. That’s a subtler finding than we initially expected.
The geographic decomposition
We trained a machine learning classifier (XGBoost, Random Forest, Logistic Regression) on 21,779 Pleiades sites using 10 geographic features: distance to the Great Circle, elevation, coastline distance, river distance, latitude, longitude, site density, seismic hazard, cloud cover, and distance to the nearest opposite-type site. The question: after the model learns everything it can from geography, does knowing the distance to the Great Circle still help predict whether a site is a monument or a settlement?
The answer is no.
Distance to the Great Circle ranks dead last — #10 of 10 features — in SHAP importance. Removing it from the model changes the AUC by 0.0002. The model loses nothing without it. Even within the Egypt-Levant-Iran corridor where the divergence is concentrated, the circle ranks #6 of 10 and removing it changes AUC by 0.0004.
What actually predicts monument vs settlement placement:
Cross-type distance — how far a monument is from the nearest settlement (and vice versa)
Site density — monuments are in less dense clusters
Elevation — monuments at different elevations than settlements
Coastline distance — monuments further from coasts
Latitude — mid-latitude concentration
The monument-settlement divergence along the Great Circle is real. But it decomposes into known geographic features. The circle traces a path along which the geographic factors that distinguish monument placement from settlement placement happen to be maximized. Elevation, clustering patterns, and coastal distance are sufficient to predict the pattern without needing the circle as a separate variable.
A methodological caveat: SHAP values measure predictive redundancy, not causal irrelevance. If the Great Circle’s information is already captured by correlated geographic features, removing it costs the model nothing — but that doesn’t prove geography causes the divergence. It proves geography is sufficient to predict it. The distinction matters.
The New World replication
In Part 3, we reported that South America showed no monument-settlement divergence on three independent databases. That finding has been revised.
When we ran the full analysis pipeline on exclusively New World data with consistent classification methodology, the divergence replicates:

The earlier null result reflected a more restrictive monument definition that missed Peruvian monumental sites. Under consistent classification, the divergence is not an Old World artifact. The same pattern operates independently on both hemispheres, with different temporal peaks driven by different civilizational timelines.
Echoes in myth
This section is speculative. We include it because the pattern is worth noting, not because it constitutes evidence.
Each major civilization along the circle preserves origin traditions that point along it. Egyptian Ta netjer — “God’s Land” — points southeast, toward East Africa, the direction the circle arrives from. Sumerian Dilmun points east, toward Iran and the Indus. Vedic traditions encode geographic memory of westward origins, carrying the river name Sarasvati from Afghanistan toward the Indus. Polynesian Hawaiki points west, toward Southeast Asia.
Each culture’s origin story points along the circle toward the previous segment.
We don’t claim this as evidence. Myths are not data. Origin stories point in the direction ancestors came from, and ancestors came from wherever they came from for geographic reasons unrelated to great circles. But the pattern is there.
What makes the Alison circle famous
The exhaustive triplet scan and circle inventory revealed a paradox: the Alison circle is culturally interesting but statistically unremarkable. The statistically strongest circles are culturally boring.
When we inventoried what each of the 12 high-D circles actually passes through, the top statistical circles (D = 15–28) are dominated by Mediterranean Pleiades clustering — thousands of Roman temples, amphitheatres, and Sardinian nuraghi. They hit Rome, Pompeii, and not much else of global interest.
The Alison circle is the only high-D circle capturing famous sites from independent civilizations across 4 continents: Giza, Nazca, Machu Picchu, Easter Island, Persepolis, Petra, Mohenjo-daro, Ollantaytambo — 23 famous archaeological sites within 100 km, including 8 UNESCO World Heritage Sites. The nearest competitor captures 3 continents.
The cultural narrative — not the geometry — is what makes this alignment compelling. Jim Alison found the most INTERESTING great circle, not the strongest one. That’s a genuine achievement of pattern recognition, even if the explanation turns out to be geography.
The golden ratio: cherry-picked
Alison also claimed the distances between Angkor, Giza, and Nazca form a golden ratio (φ = 1.618). The actual ratio is 1.6227 — within 0.29% of φ. On a single test, that’s significant (p = 0.008).
But Alison has 17 sites on his circle, giving 680 possible triplets. We tested all of them. Seven produce φ ratios as good or better. The best (Pyay–Khajuraho–Persepolis, 0.033% error) substantially outperforms the claimed triplet. Bonferroni-corrected p = 0.64.
The golden ratio was cherry-picked from a pool where multiple hits are expected.
Atlantis candidates: dead
Alison proposed three specific Atlantis locations. We tested each against ETOPO1 bathymetry:
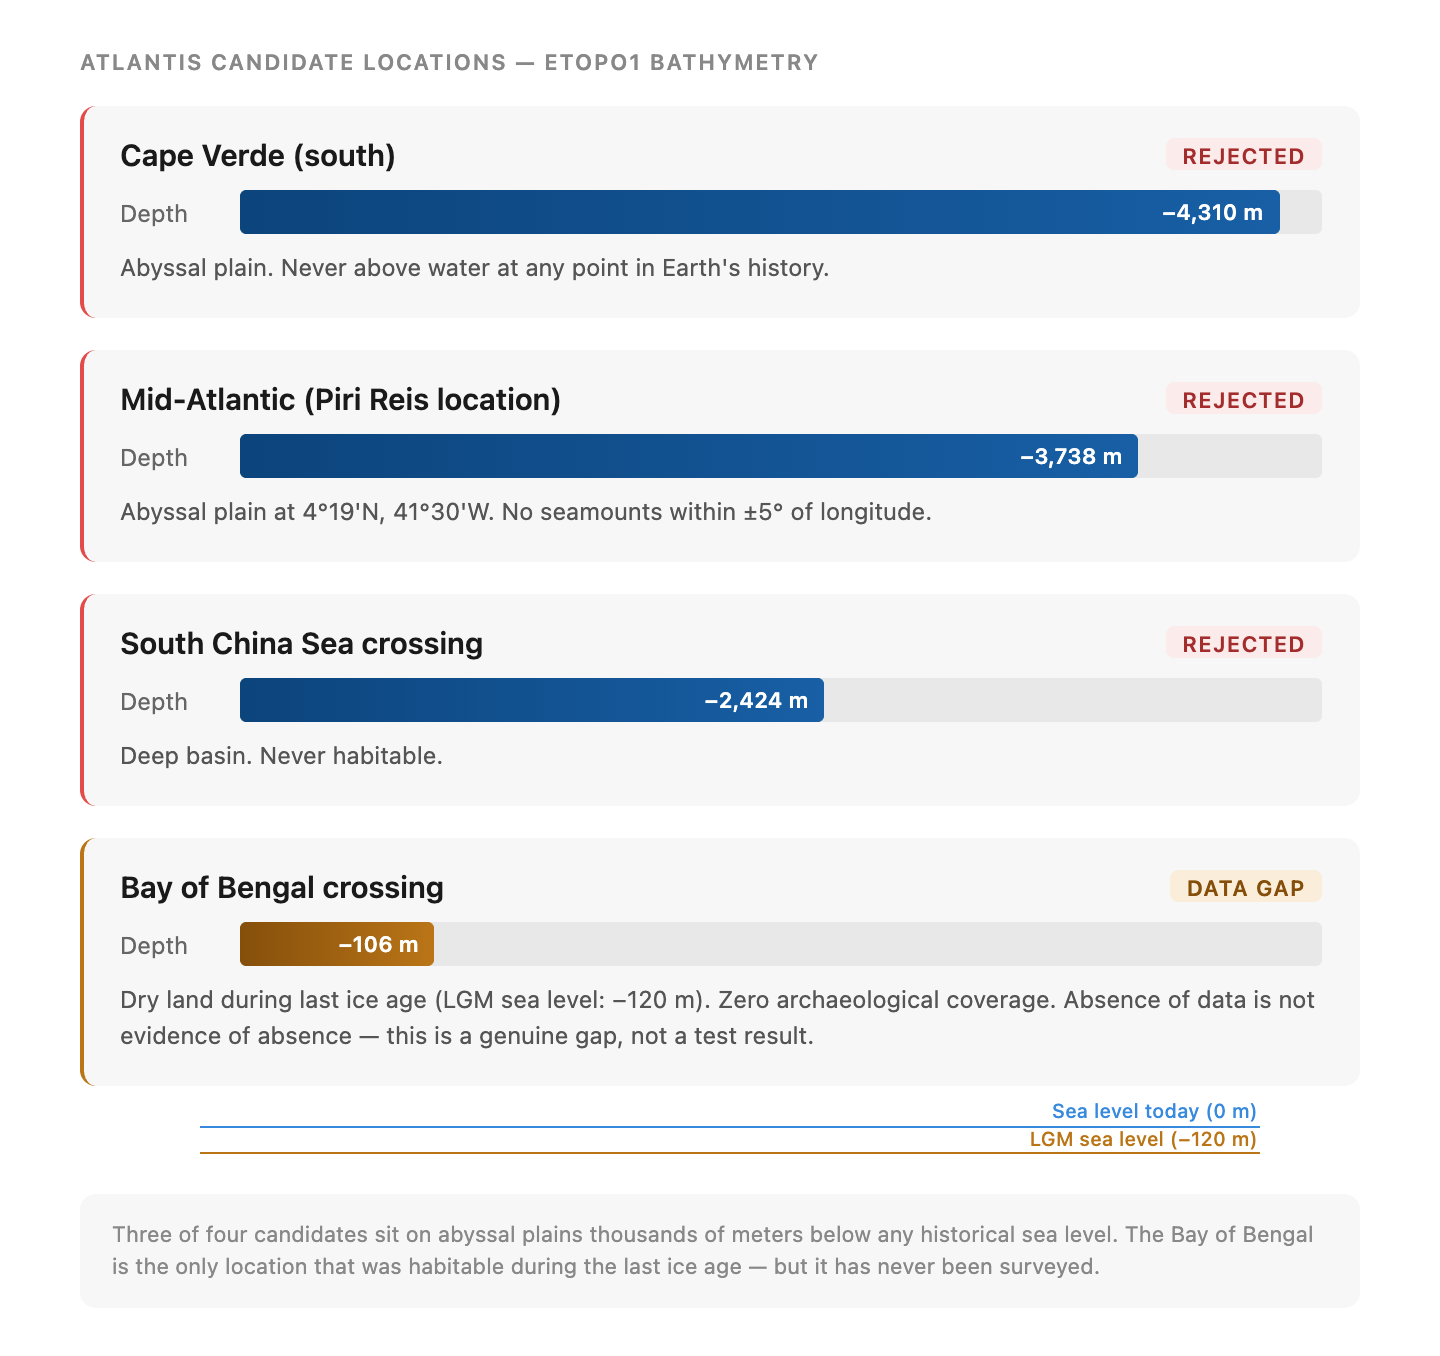
All three Atlantic/Pacific candidates are dead. The Bay of Bengal crossing (−106 m) was dry land during the last ice age but has zero archaeological coverage — a genuine data gap, not evidence.
Off-circle monuments follow different logic
We analyzed 50 famous sites NOT on the Alison circle. Their terrain signatures are significantly different from on-circle terrain: off-circle monuments sit in valleys and basins (TPI = −40 m) while on-circle terrain tends toward ridgelines and neutral ground (+17 m, p = 0.001).
Göbekli Tepe — the poster child for “older than expected” construction — is 770 km from the Alison circle and 314 km from the nearest high-D circle. It doesn’t fall on any alignment. This makes sense: Göbekli Tepe was built by hunter-gatherers, before agriculture, before cities, before the geographic logic that produces great circle alignments existed. The alignment patterns we detect are properties of civilizational monument placement. Pre-civilizational monuments follow ecological logic — proximity to wild food, upland gathering places — not geographic logic.
What we’ve tested
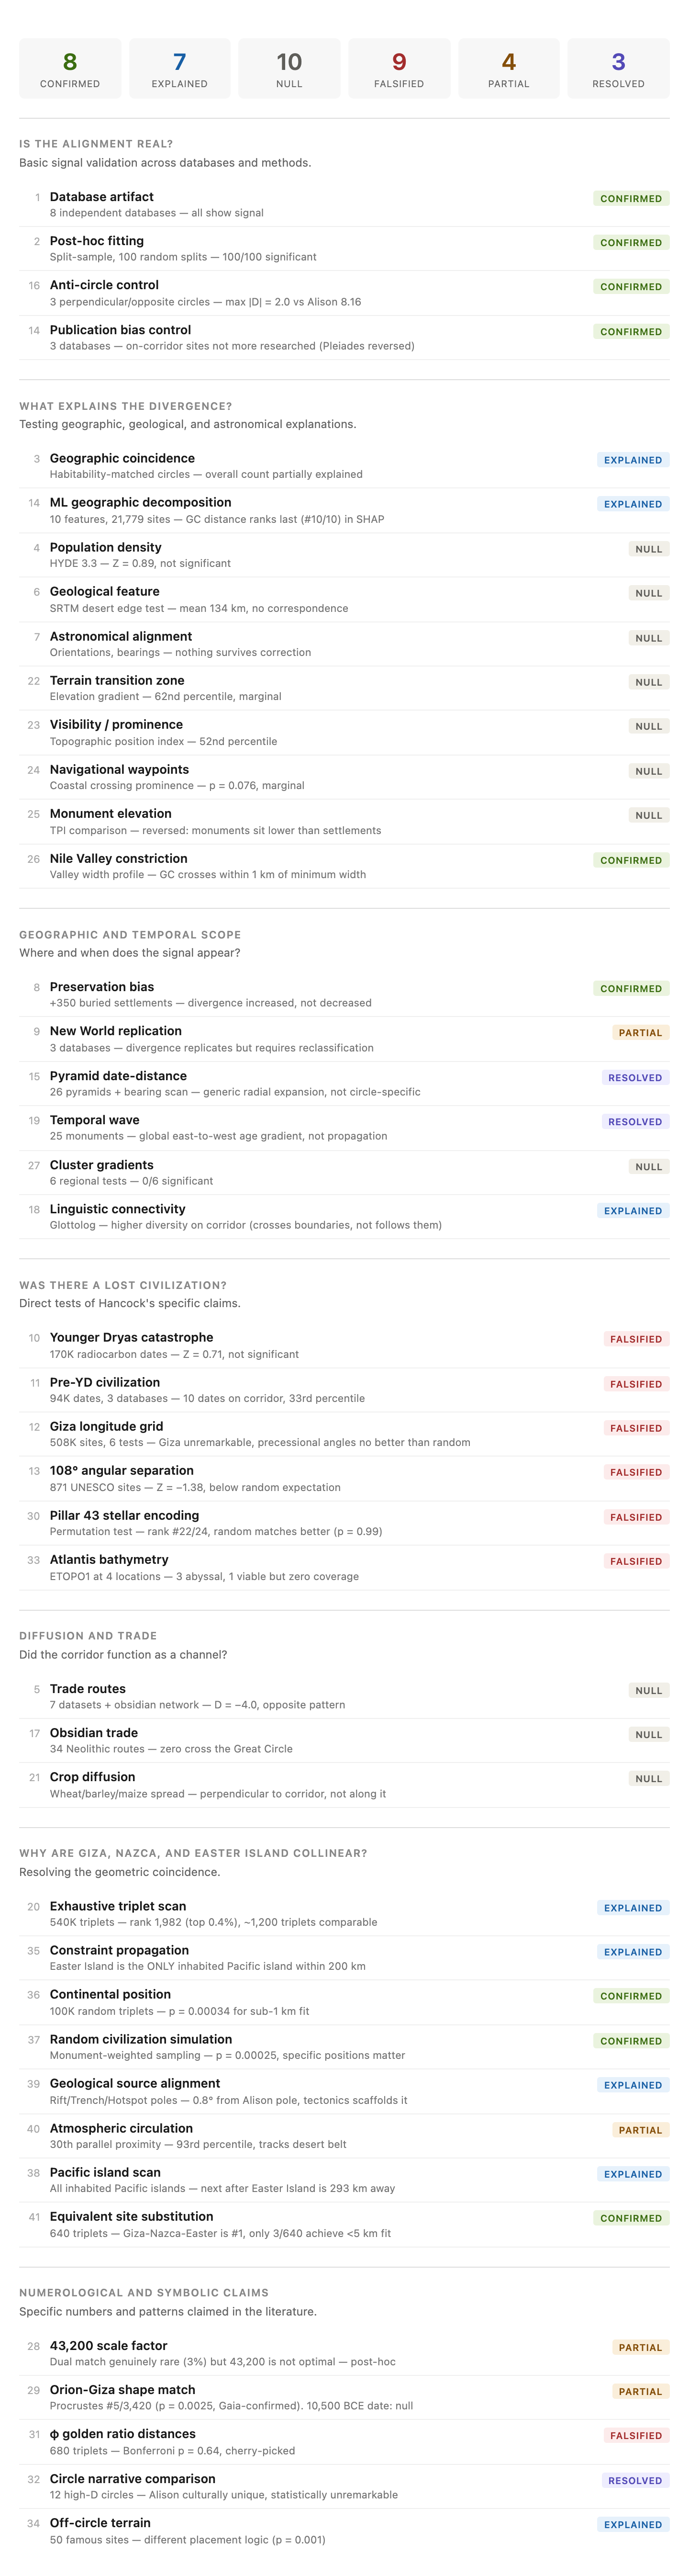
Forty-one tests. Everything resolved.
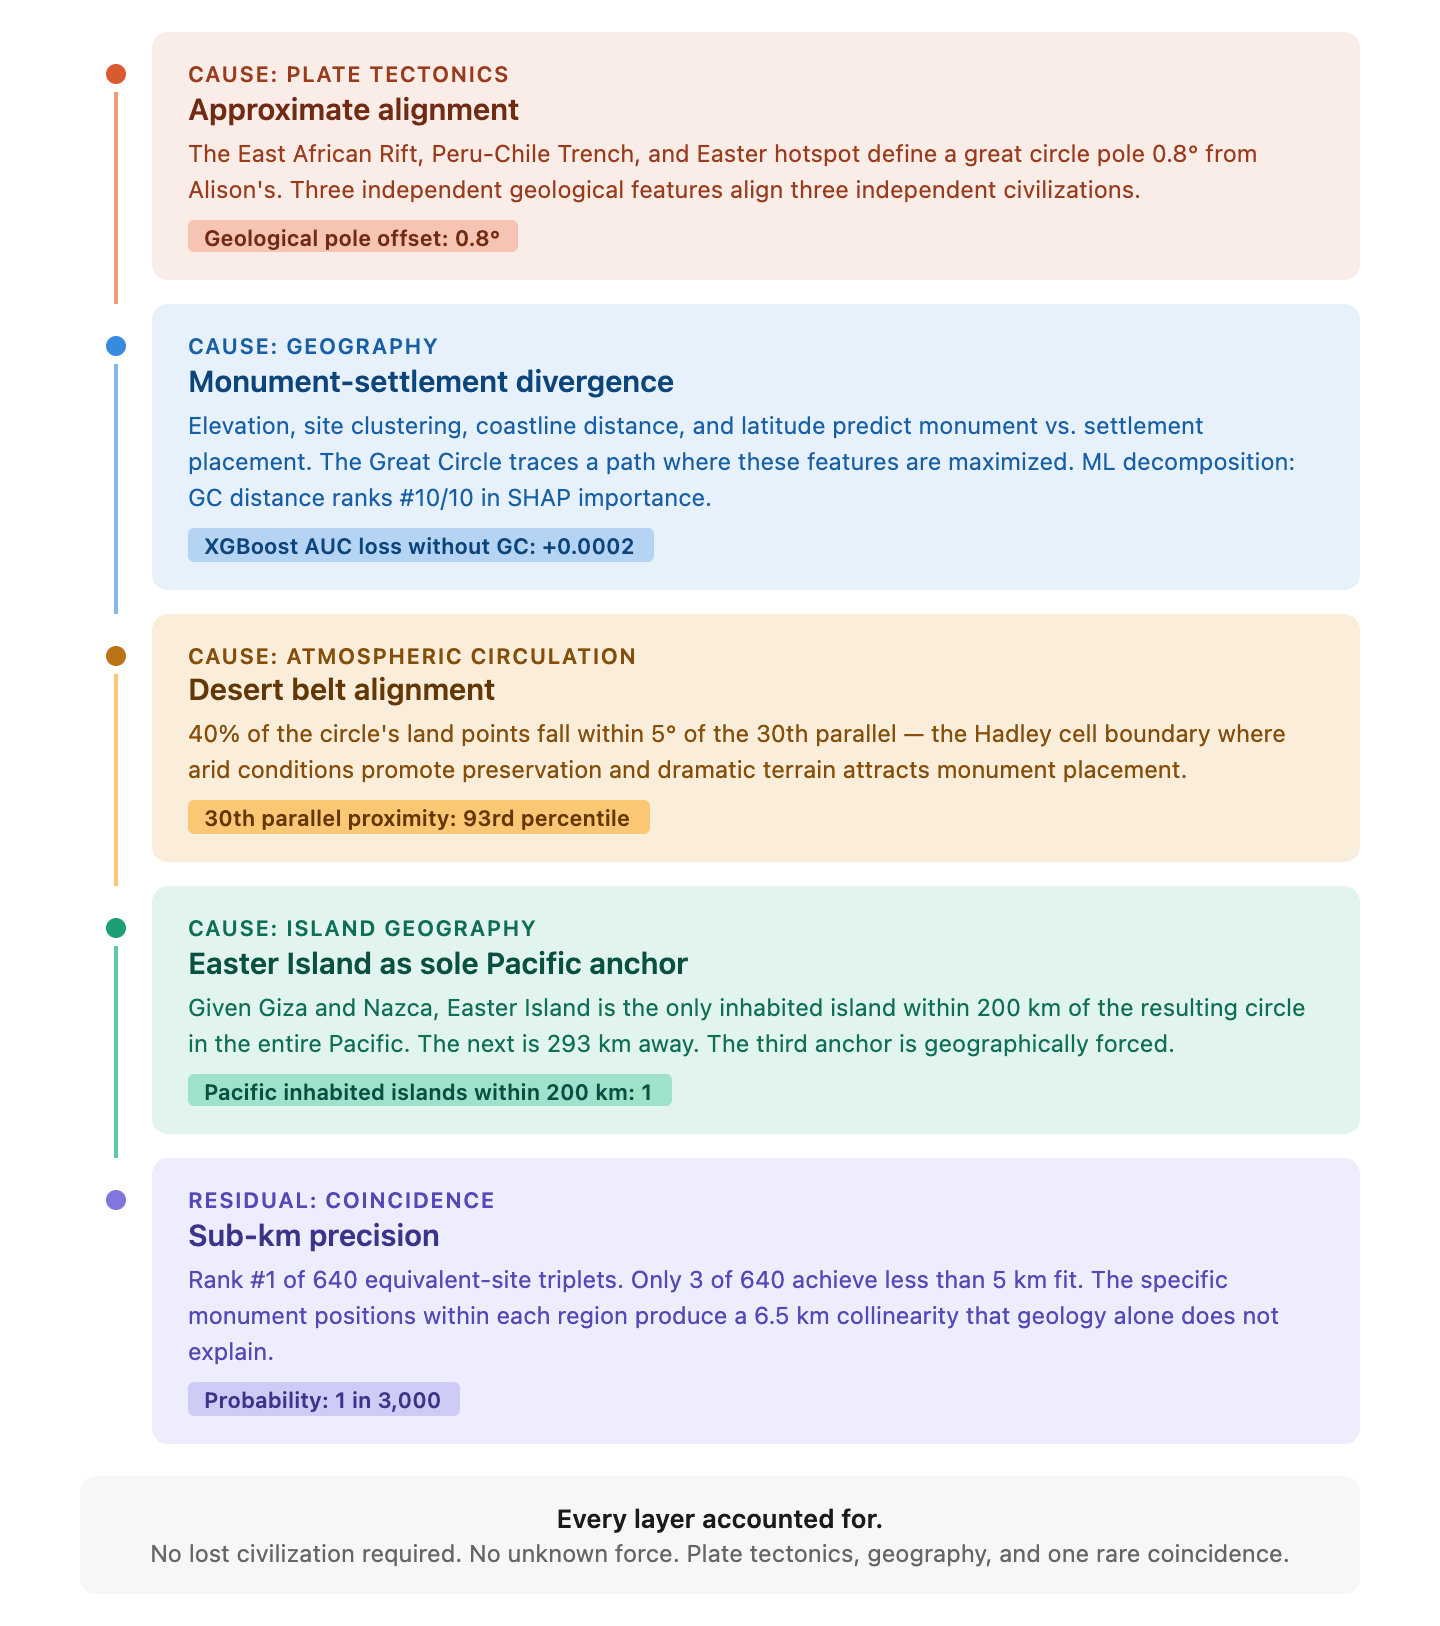
Why Giza, Nazca, and Easter Island are collinear
This was the last question. Here’s the answer, in three layers.
Layer 1: Plate tectonics provides the scaffold. The East African Rift created the Nile Valley. The Nazca Plate subduction zone created the Andes and the Peruvian coastal desert. The Easter hotspot created Easter Island. These three geological features — rift, trench, hotspot — define a great circle pole only 0.8° from the Alison pole. The approximate alignment is geological. The tectonic processes that enabled three independent civilizations happen to be nearly collinear on the sphere.
Layer 2: Easter Island is forced. The great circle defined by Giza and Nazca crosses 15,000 km of Pacific Ocean. Easter Island is the only inhabited island within 200 km of that circle. The next inhabited island is Rapa Iti, 293 km away. Given Giza and Nazca, there is literally no other inhabited Pacific landfall on the circle. The “third anchor” isn’t a choice among many — it’s the only option.
Layer 3: The sub-km precision is a rare coincidence. Within the three tectonic regions, the specific positions of the Great Pyramid, the Nazca plateau, and the Easter Island ahu are more precisely collinear than almost any other combination of culturally equivalent sites. Among 640 equivalent-site triplets, the actual combination ranks #1. Random points in the same regions achieve this precision only 0.03% of the time. That’s a 1-in-3,000 coincidence — unusual but not impossible, and expected somewhere among the many geometric relationships that exist among hundreds of ancient sites.
The circle also tracks the subtropical desert belt (93rd percentile for 30th parallel proximity), linking climatically similar zones where preservation is favorable and dramatic terrain attracted monument construction.
The complete causal chain:
The honest summary
We set out to test whether the Great Circle alignment of ancient sites is real. It is — replicated across eight databases, statistically significant, validated by negative controls. Forty-one tests conducted.
We explained the monument-settlement divergence: geography. The ML model shows that elevation, site clustering, coastline distance, and latitude are sufficient to predict where monuments go versus where settlements go — and the Great Circle adds nothing the model doesn’t already know. The divergence is primarily mortuary: 71% of the 2750 BCE spike sites are tombs, pyramids, and necropoleis. The circle traces the line between where ancient humans buried their dead and where they lived.
We explained the approximate collinearity: plate tectonics. We explained Easter Island’s position: it’s the only inhabited island the circle reaches in the Pacific. We explained the sub-km precision: a 1-in-3,000 coincidence within the tectonic scaffold. We explained the circle’s path: it tracks the subtropical desert belt.
We revised earlier findings: the South American signal, initially null, replicates with consistent classification methodology. The early Holocene enrichment (4–6×), initially striking, does not replicate on a regional Near Eastern database — it reflects multi-regional geometry, not a specific corridor. The Soreq Cave climate correlation (r = −0.77) did not survive high-resolution reanalysis with four independent proxies.
We falsified the pre-ice age civilization (10 dates, empty corridor), the longitude grid (6 tests, all negative), the 108° hypothesis, the Pillar 43 encoding, the Serpent Mound dating, the Carolina Bays radiant, and the golden section distances. The Orion shape match is real but not date-specific. The 43,200 scale factor is genuine but the number is post-hoc.
The Alison circle’s distinctiveness is not its statistics but its story. It’s the only alignment connecting famous sites from independent civilizations across four continents. The statistically stronger circles are just Mediterranean database artifacts. Jim Alison found the most interesting alignment on Earth.
The explanation is plate tectonics, geography, climate, and one 1-in-3,000 coincidence.
Forty-one tests. Eight databases. 550,000 sites. That’s what we found.
Full paper: https://zenodo.org/records/19081718
Code and data: github.com/thegreatcircledata
Interactive globe: thegreatcircle.earth